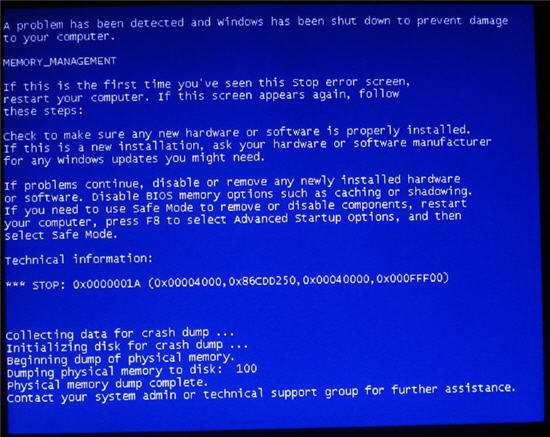
Microsoft Blue Screen Of Death (BSOD) – everyone knows them, everyone hades them. When the system crashes, and a BSOD is shown, a mini-dump file is created which contain a crash report. This tutorial shows how to use Microsoft Debugging Tools to analyze this file and hopefully find the reason for the system crash.
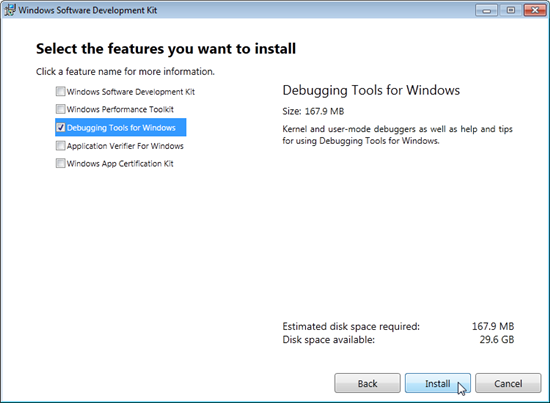
1. Download and install Debugging Tools for Windows
You´ll only need to install the Debugging Tools for Windows packet.
Ones you are done installing start up Windows Debugging Tools:
2. Navigate to All Programs | Windows Kits | Debugging Tools for Windows (x86)| WinDbg (x86)
If you are on a 64 bit system you might want to use the WinDbg (x64) instead. When Windows Debugging Tools are up and running the first thing you want to do is to define how the program should download debugging symbols.
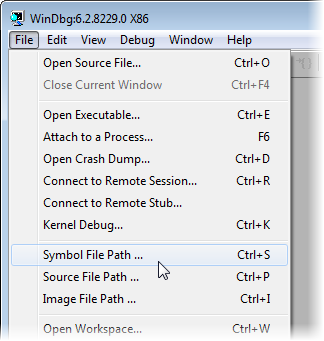
3. Click on File | Symbol File Path…
The dialog box Symbol Search Path opens.
4. Click in the input field and type SRV * C: \ Symbols *
5. Click the OK button
The dialog box Symbol Search Path closes. You are now ready to open the mini-dump file containing the crash report.
6. Click on File | Open Crash Dump…
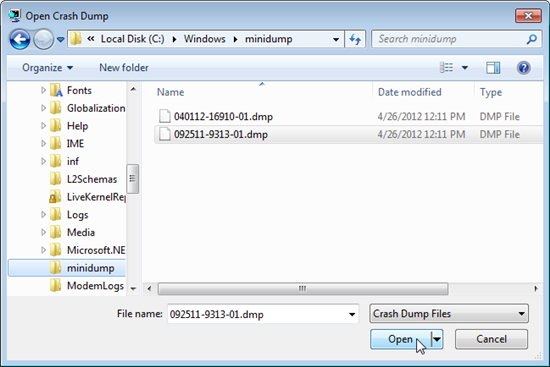
The mini-dump files are stored in C:\Windows\minidump and are named according to the date of the crash. The dialog box Open Crash Dump opens.
7. Navigate to C:\Windows\minidump and click the newest mini-dump file
8. Click the Open button
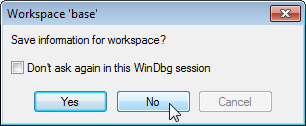
The dialog box Open Crash Dump closes and the dialog box Workspace ‘base’ opens.
9. Click the NO button
The dialog box Workspace ‘base’ closes. A new window opens with a command prompt telling that the debugger is downloading the symbols, and loading the dump file. This will take at little while, so be patient. Note that symbols and drivers from third parties cannot be loaded, and they can therefore result in errors and warnings. But often they are not needed to finder the driver or program causing the problem.
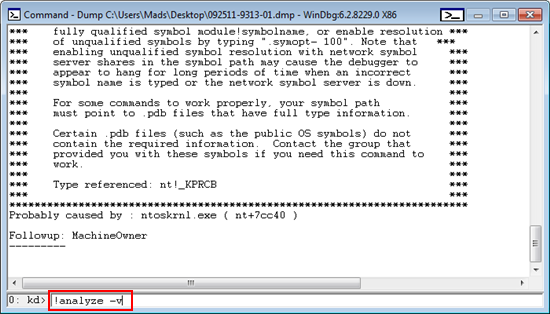
Ones the dump file has been loaded, the cause of the problem is already becoming clearer: Probably caused by: ntoskrnl.exe ( nt+7cc40 ). To get even more information you can do a detailed analyze.
10. Click in the input field and type !analyze v and press Enter
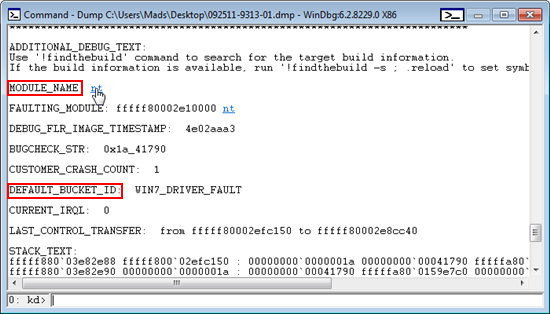
The first piece of valuable information is the BSOD error code MEMORY_MANAGEMENT (a1), this is worth googling, and might tell you what caused the crash.
A little further down, you get the DEFAULT_BUCKET_ID – which tells us which category the error is in. This is sometimes misleading, but it can give a general hint whether it is a software or hardware issue.
Near the bottom you will see something called MODULE_NAME
11. Click the link next to MODULE_NAME
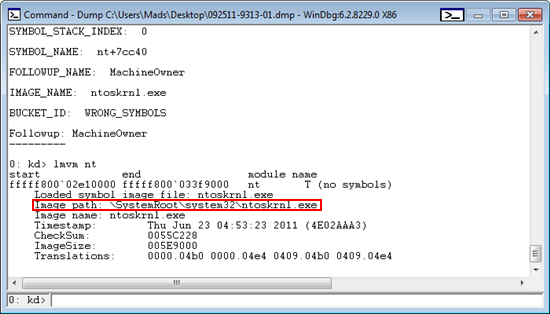
This gives you further information about the module which failed. Especially Image path tells you where the module was while it was running. In this case it was in the /system32 folder, which tells you that it is a critical system process. In other cases it might have been in the /system32/drivers folder or somewhere else, which could have given you a clue on what it does.
You now know that it is a system process, and it is called ntoskrnl.exe. There is nothing left than go to Google and try out some suggested solutions. A quick search on the term ntoskrnl.exe + BSOD gives quite a few results which looks promising.
I am in no way an expert, so everything in this tutorial is written from my own experience.
Thanks to my friend Martin for borrowing me the mini-dump file for the tutorial.






Might I suggest using BlueScreenView? It’s a light weight tool that does the most important, find the program that caused the BSOD. Once that’s done, the rest is up to your google’ing skillz 🙂
For the people asknig how to point it to the minidump folder of another PC, check out windbg; part of the Windows Debugging Tools package.For some reason everyone seems to think it is hard to use, but it’s not. Run it, click File -> Open Crash Dump and choose a minidump (or the MEMORY.DMP file). It loads, and at the end of the output tells you which driver is probably responsible for the crash.To run it as a portable app, copy windbg.exe, dbgeng.dll and dbghelp.dll to your USB stick.
Cool, I’ll try it out…